Our leading-edge Gantt chart control VARCHART XGantt is available
for .NET and ActiveX applications.
Our runtime license prices will increase from January 1, 2023.
In case you have any questions, please get in touch with sales@netronic.com
Time- and resource-related planning data such as jobs, tasks, orders, activities, and capacities are best displayed in Gantt charts.
In an intelligent Gantt chart, the planner can take corrective actions at his fingertips.
Speed up your development and create compelling, easy-to-use visual scheduling experiences. Being on the market for almost 30 years, VARCHART XGantt ist the most complete C# Gantt chart control for building modern and yet industry-proof scheduling applications.
Available as .NET and (still!) as ActiveX edition.
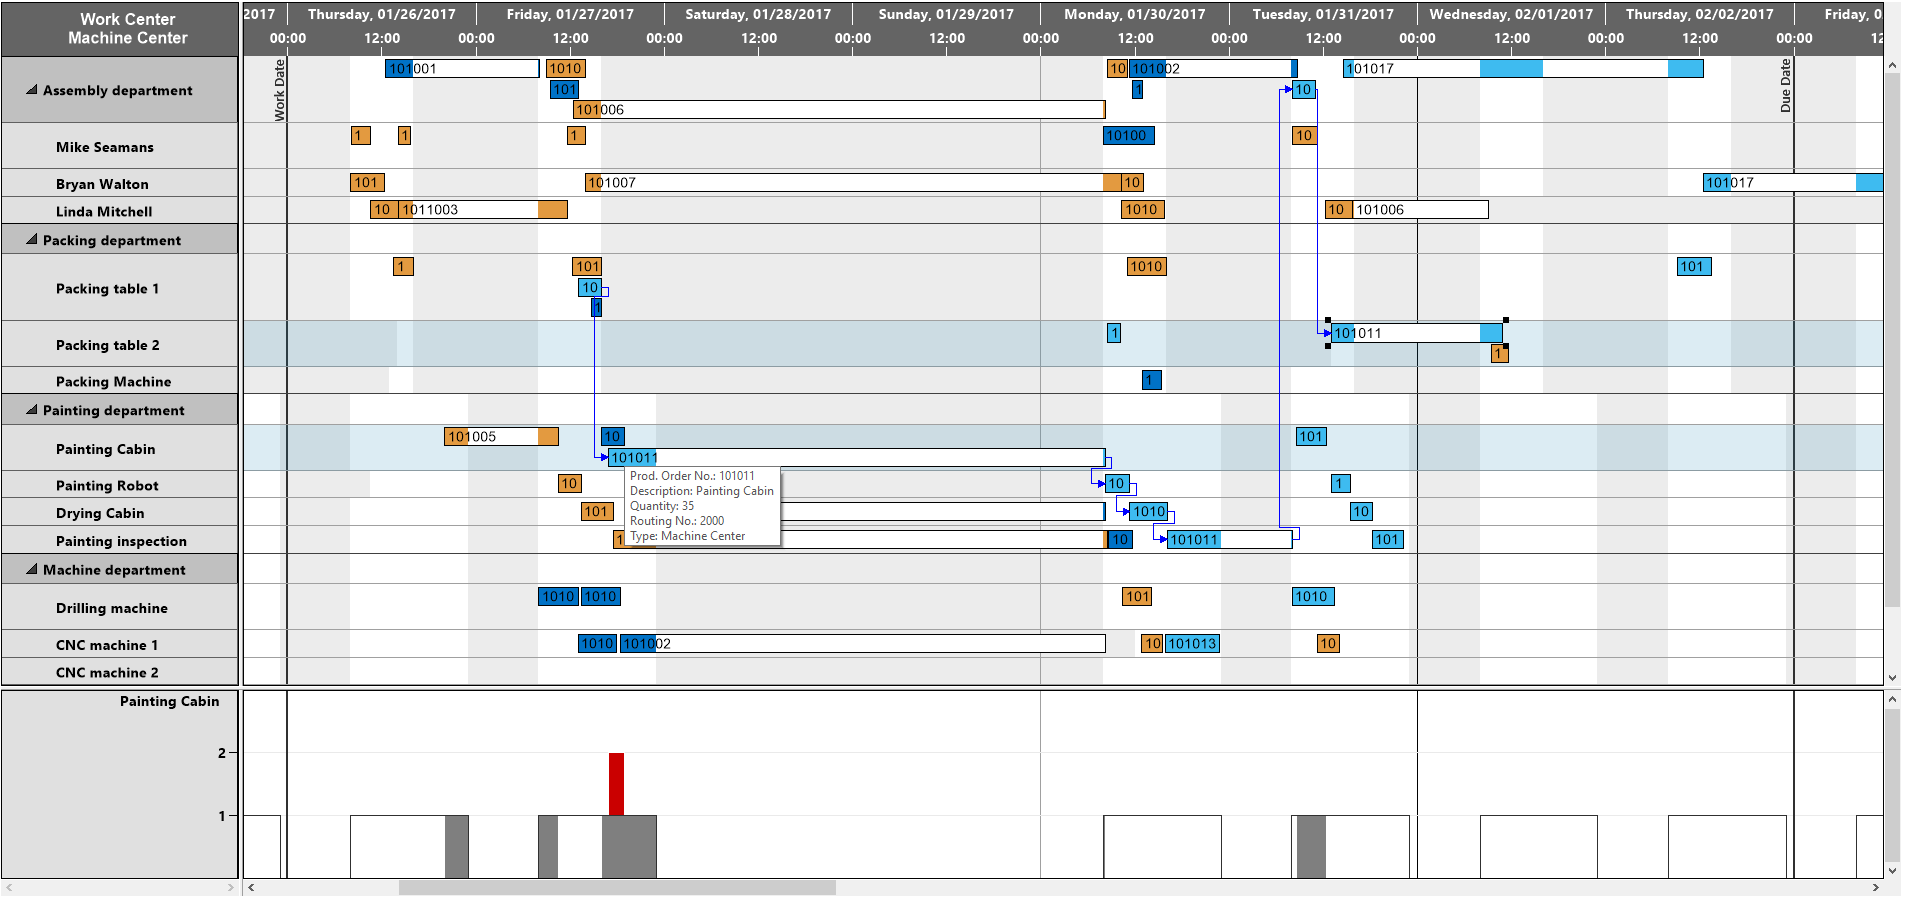
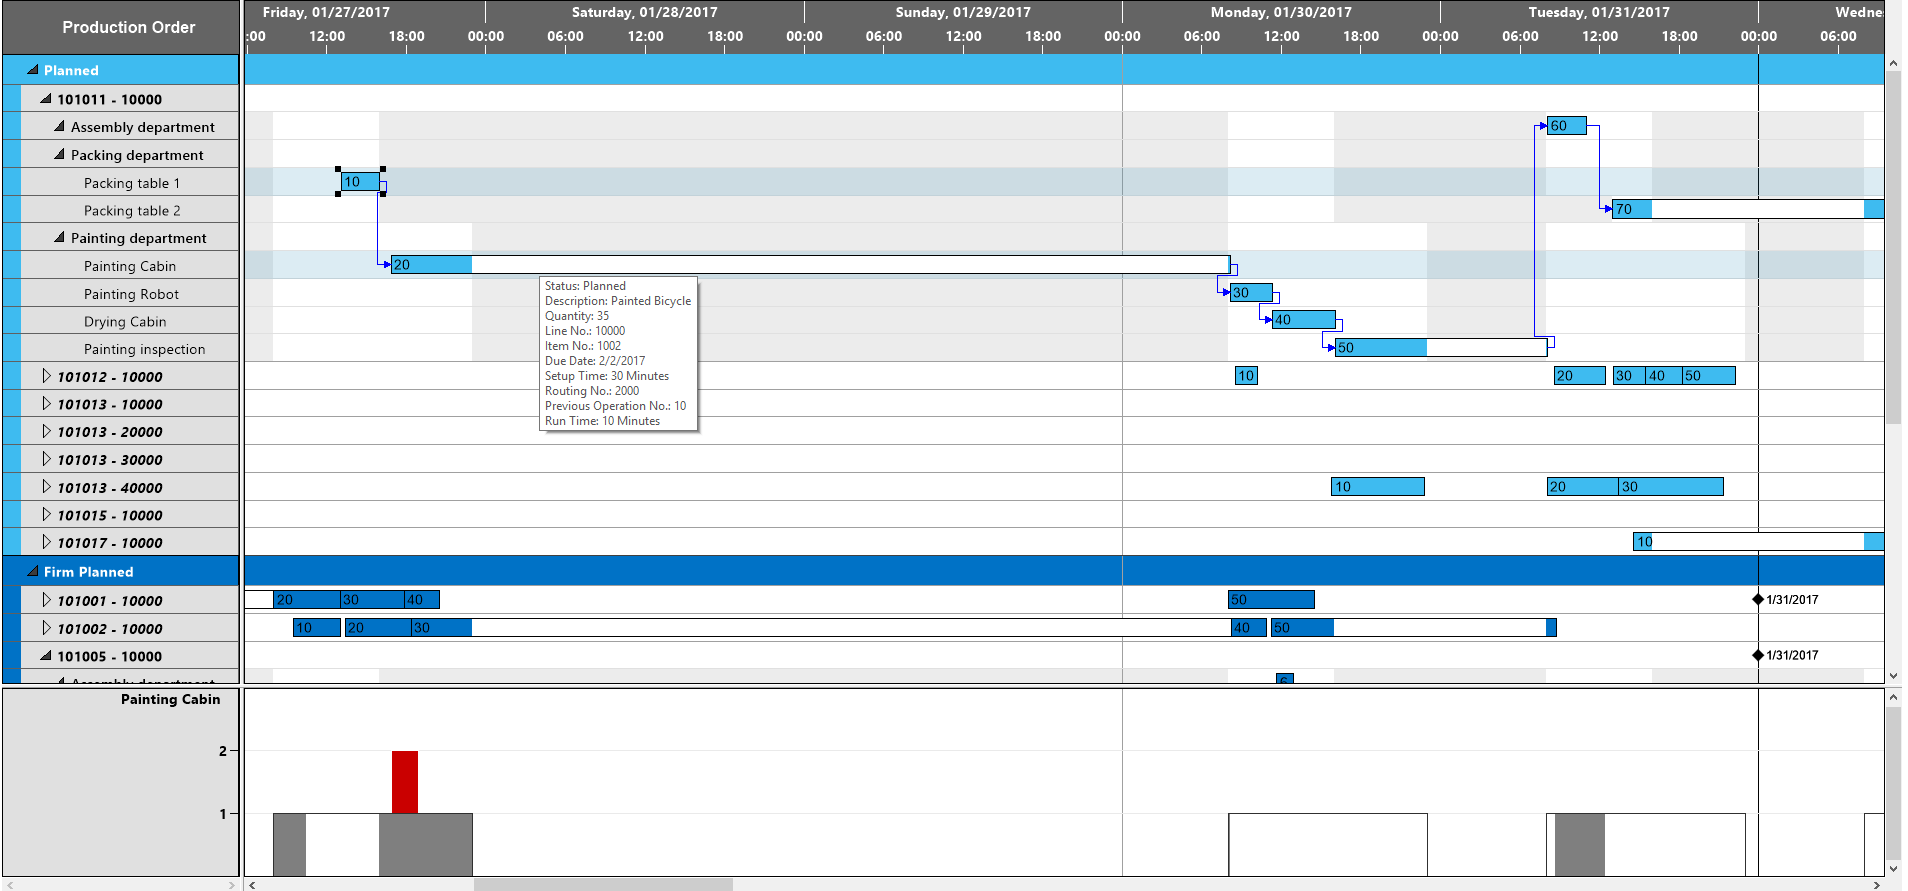
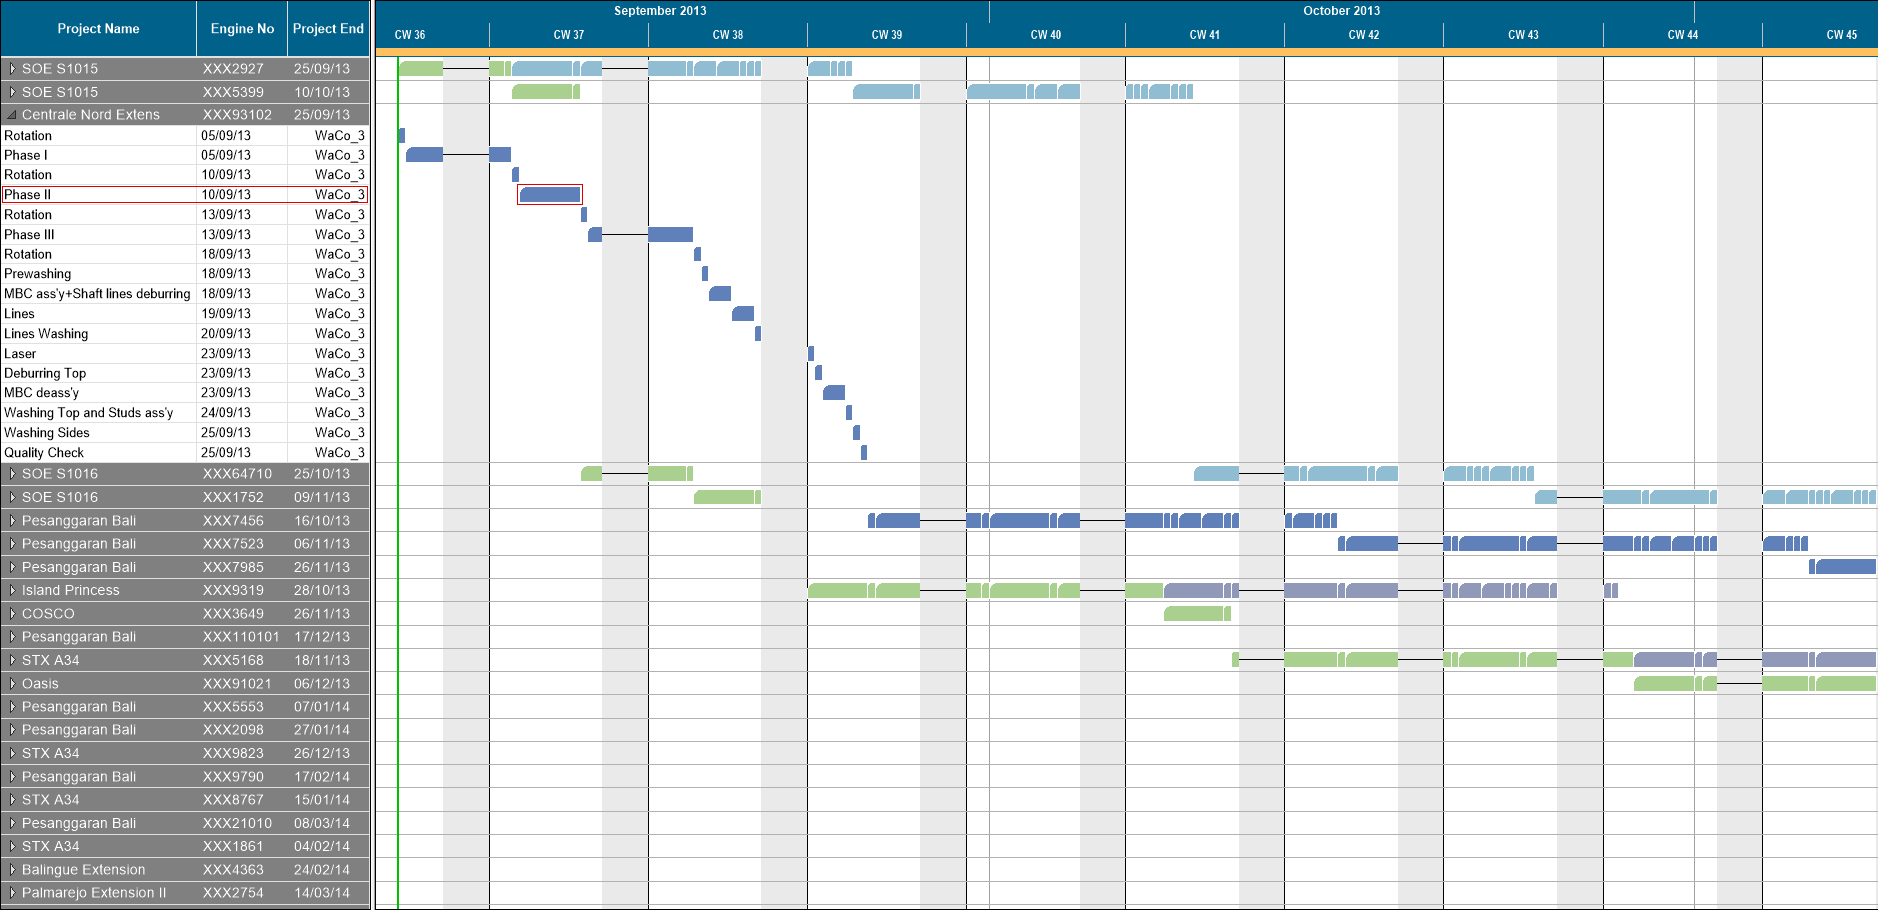
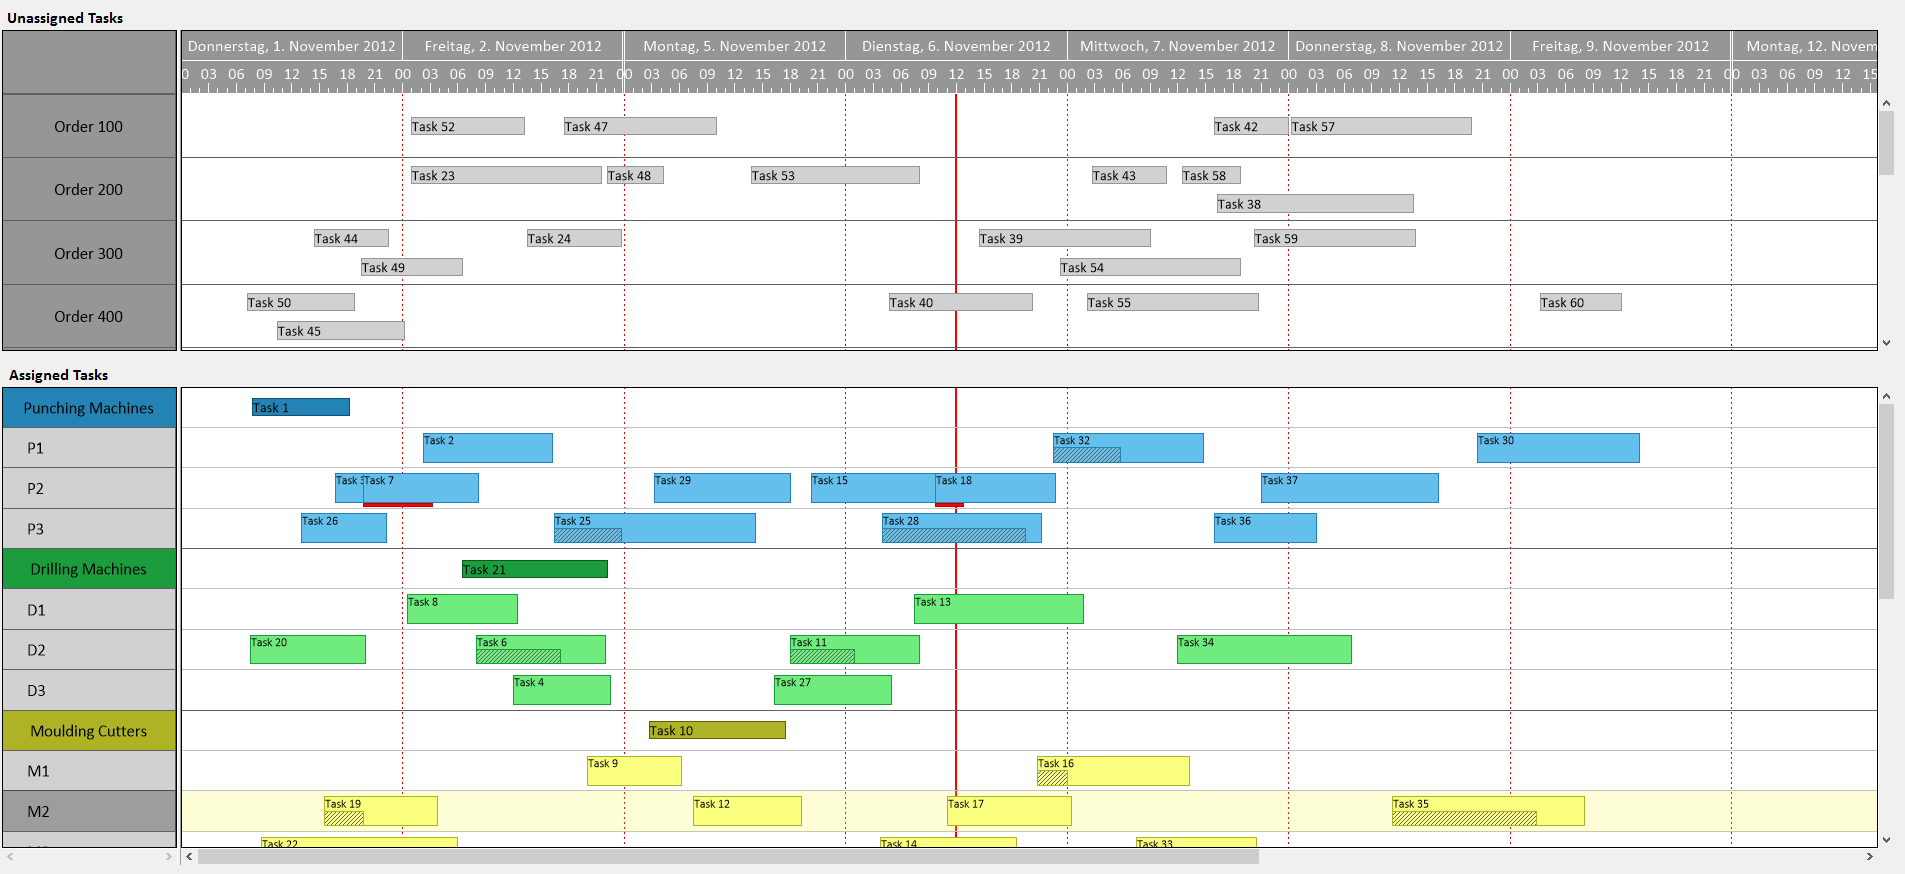
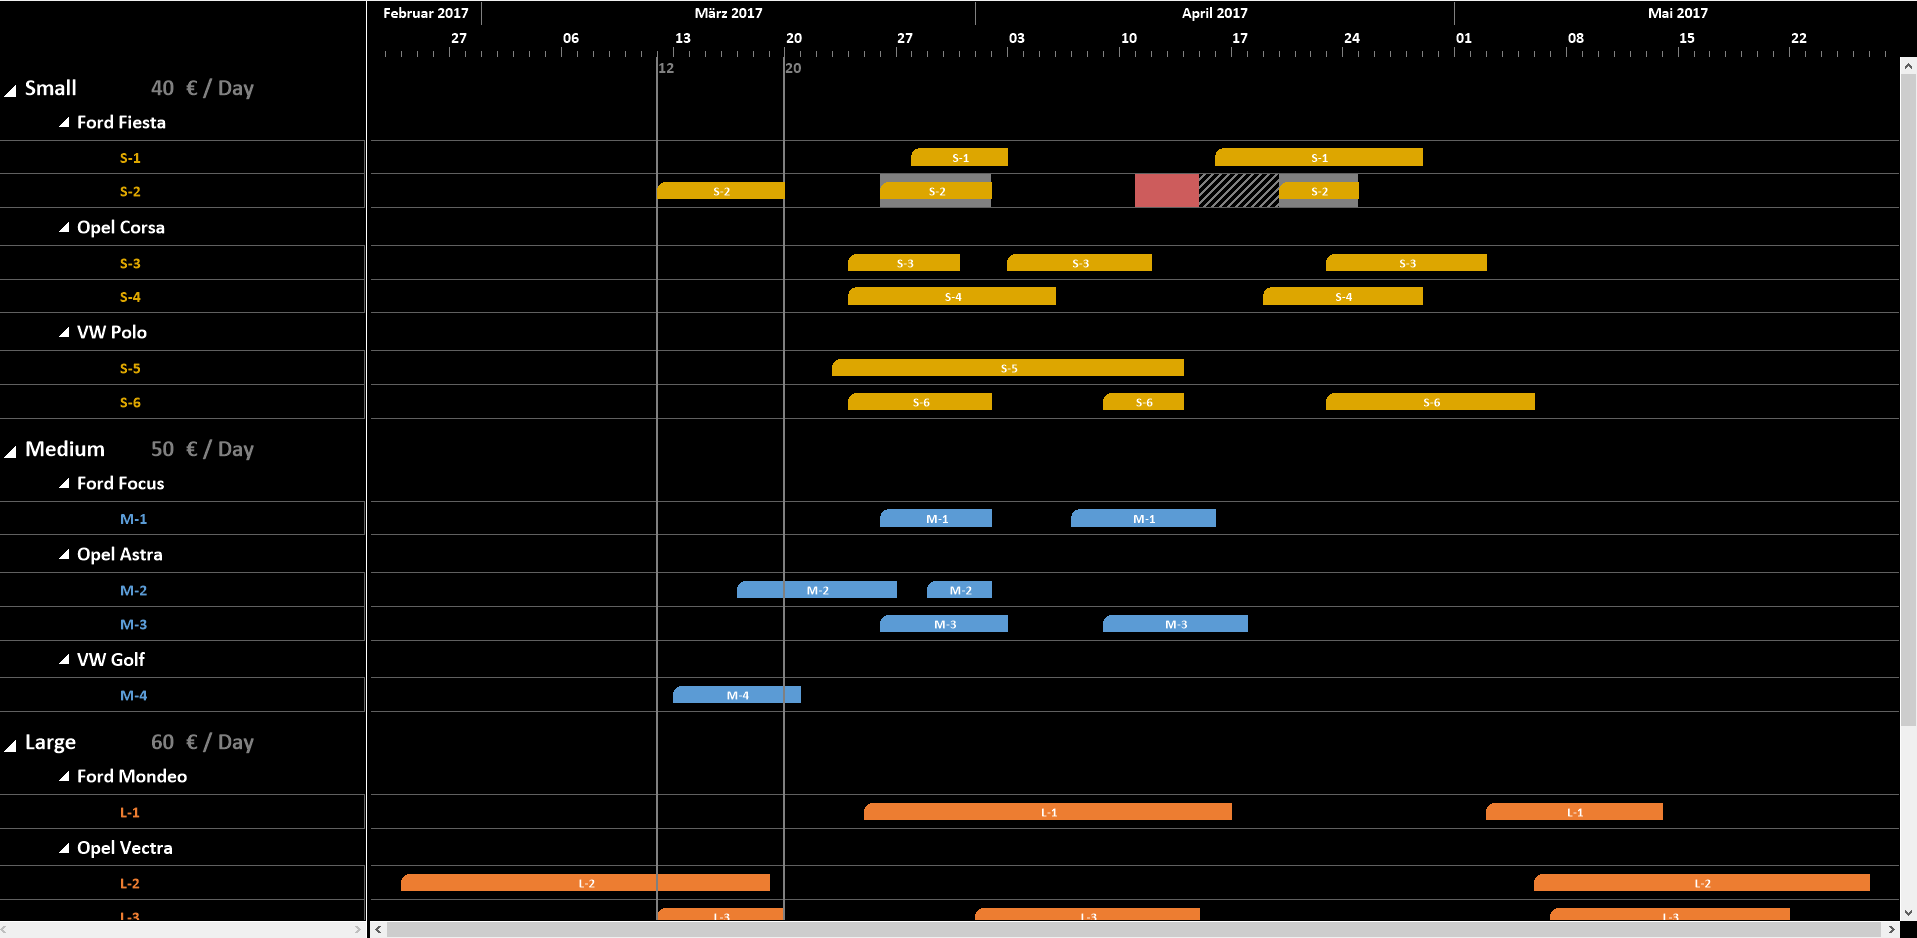
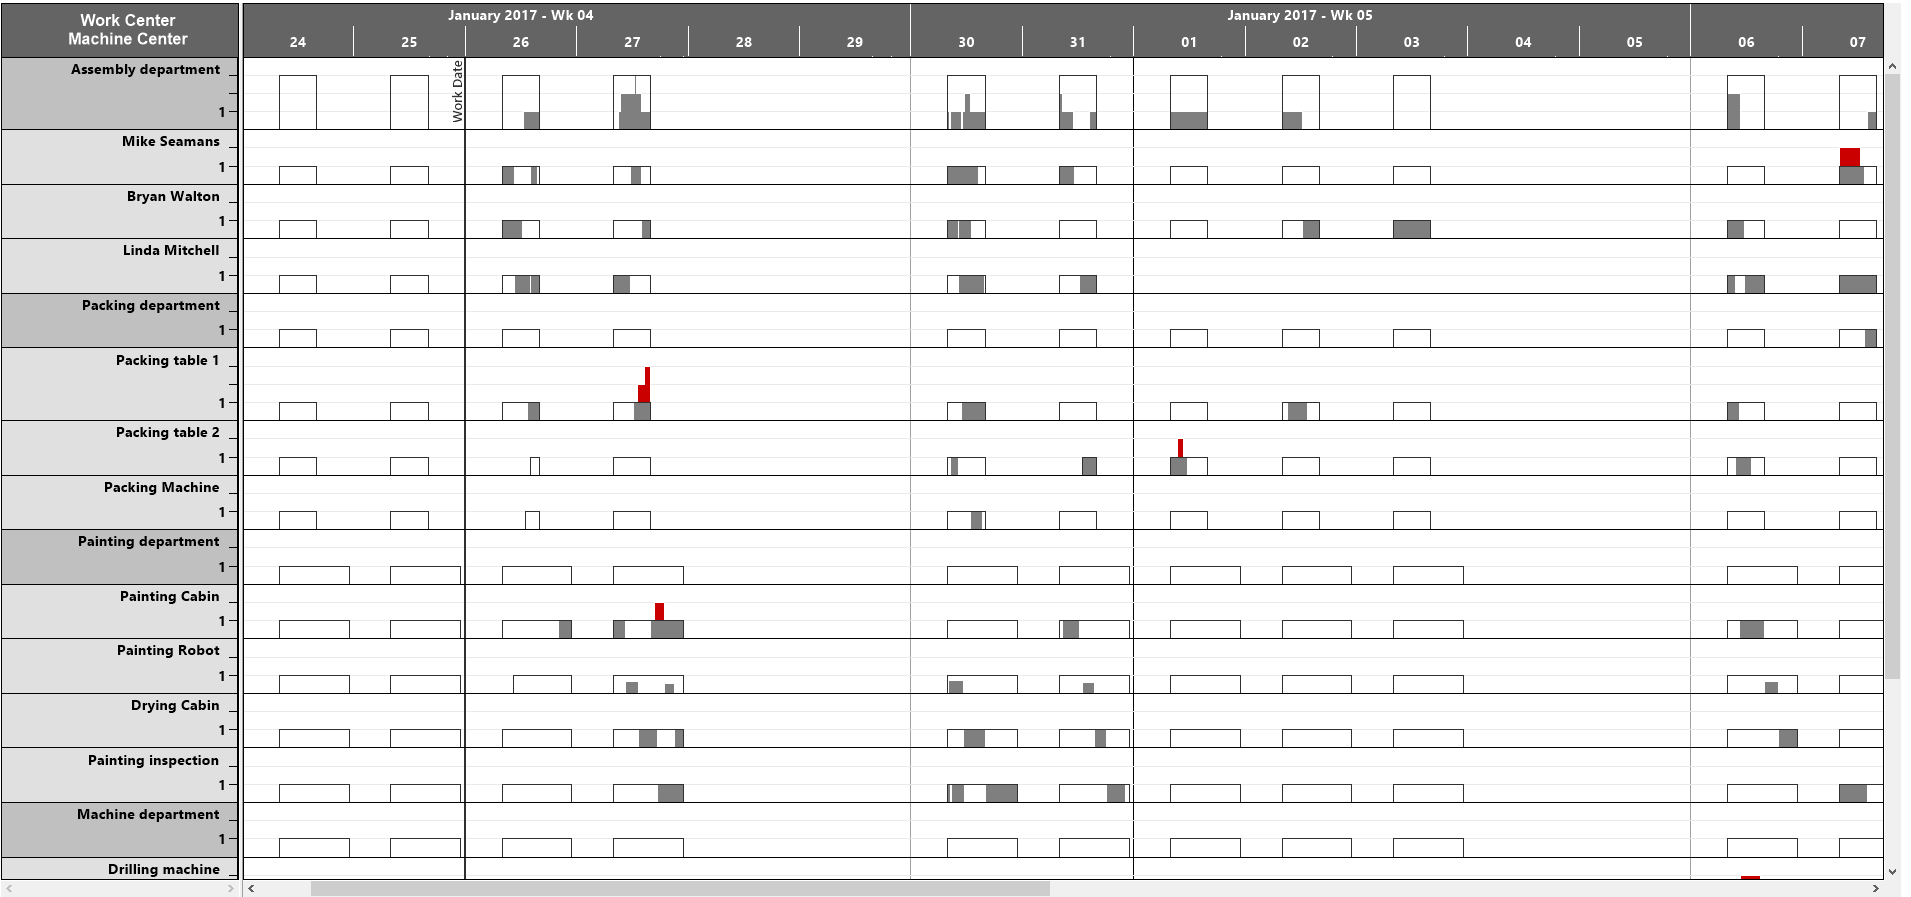
We know: seeing is believing. Have a look at four sample videos to understand how our C# Gantt chart control VARCHART XGantt can empower your planning and scheduling application. The videos either show dedicated XGantt features or applications that have been built with our .NET Gantt chart control.
Do not re-invent the wheel and do not spend weeks and months building functions that we built years ago. Benefit from a powerful API and customize your scheduling application to your exact specifications. Take advantage of our sample apps with source code, thorough documentation and a both responsive and human support.
We know that there are beautifully looking Gantt charts out there. XGantt might not look "sexy" at first glance; but most developers get excited when they take a true look under the hood. We have been building powerful, but sometimes hidden features to grow with the requirements of demanding B2B industry software solutions.
For sure, a basic Gantt chart is part of any proper UI control library. These libraries come from companies that are good at doing many things. We excel at doing one thing. We are specialists, not generalists. We live and breathe the Gantt chart and believe that we employ the most experienced C# Gantt chart development team on the globe.
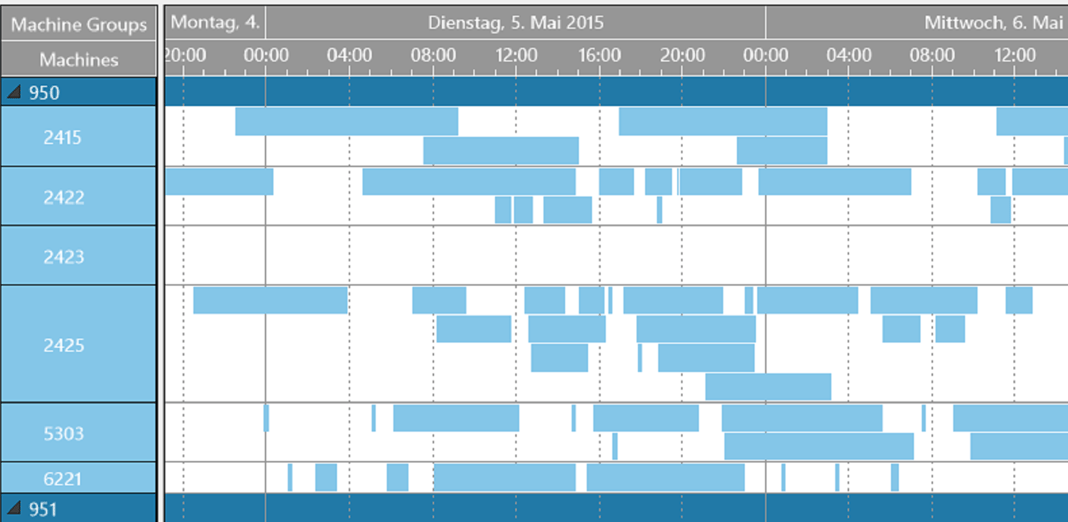
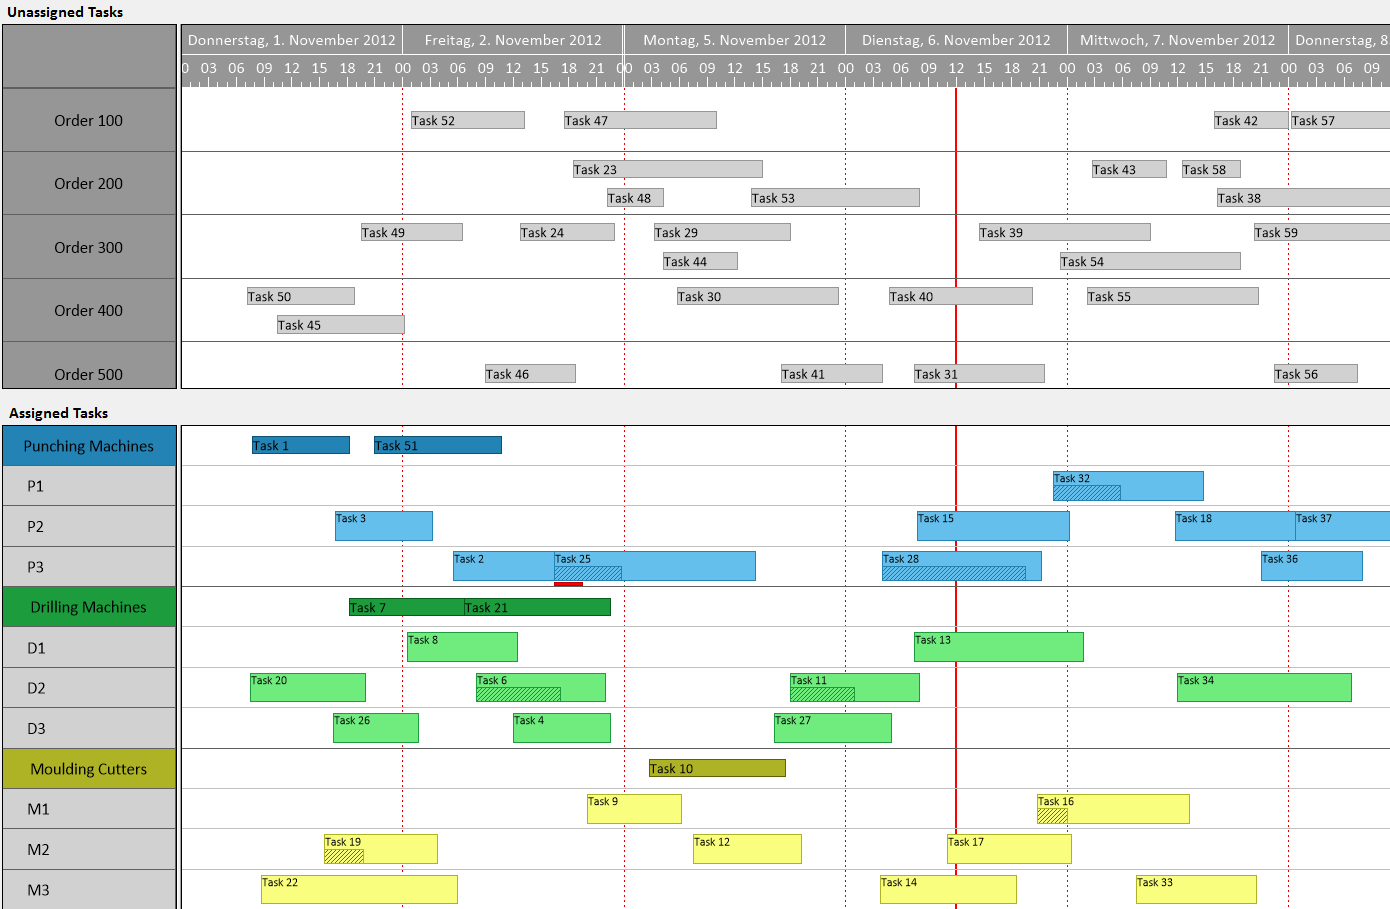
Overlapping activities are usually highlighted by a red underscore in one row. But how do you know how much the activities overlap each other? Optimize the view by arranging the overlapping activities one below the other. The row width will be adjusted automatically. This is one unique feature of VARCHART XGantt .NET and ActiveX Edition.
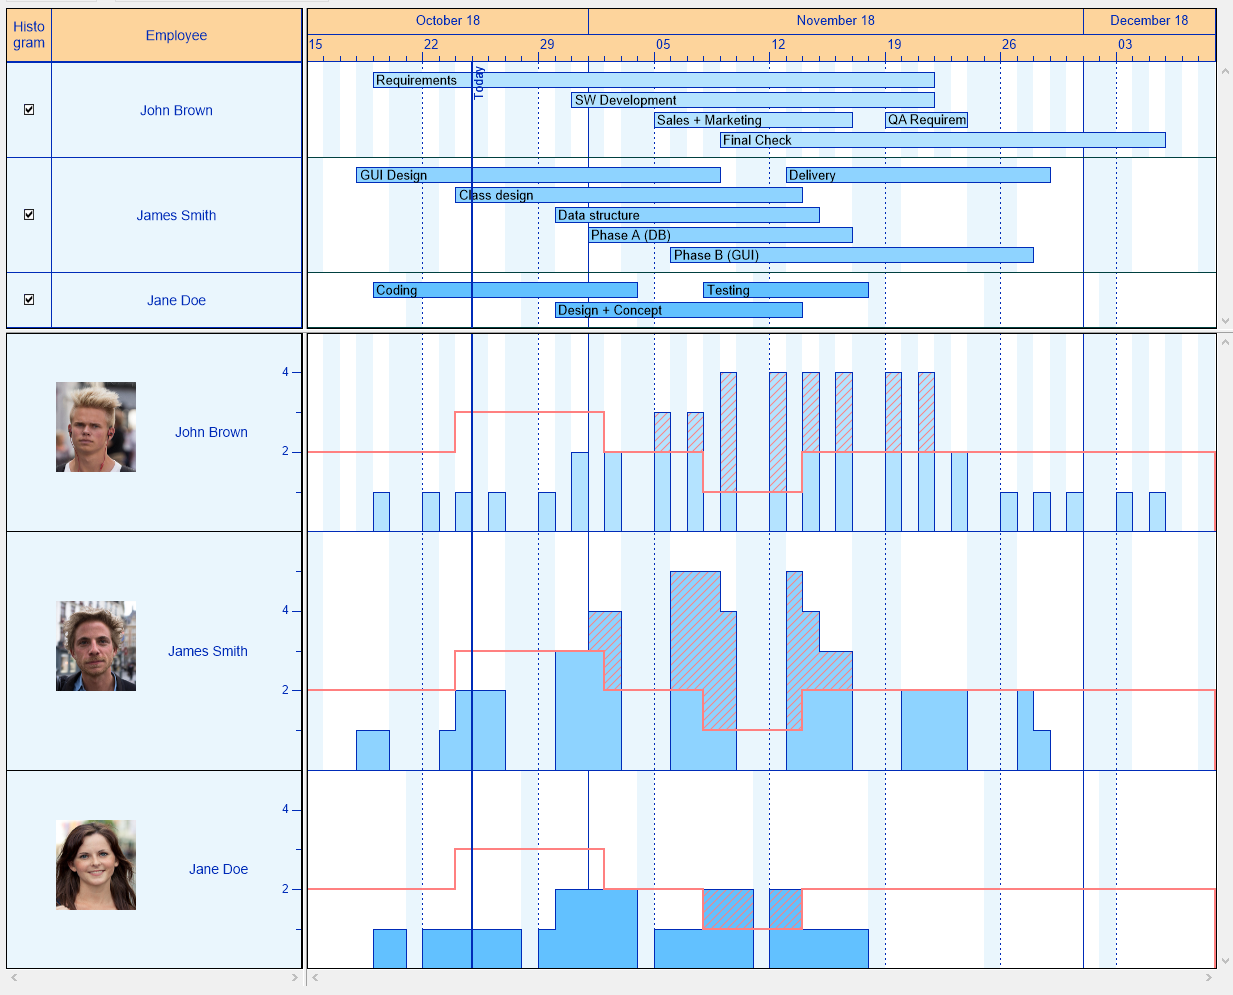
Do you need to visualize different shift calendars and/or resource calendars in your application? With VARCHART XGantt, you can manage and visualize an individual work calendar per resource, and show worktime and non-worktime in the Gantt chart. In addition to this, you can show the resource capacities and their respective utilization in a histogram and clearly emphasize them.
The VARCHART XGantt Gantt chart control allows you to arrange multiple Gantt charts on top of each other. All charts will scroll synchronously This gives you a couple of interesting capabilities such as:
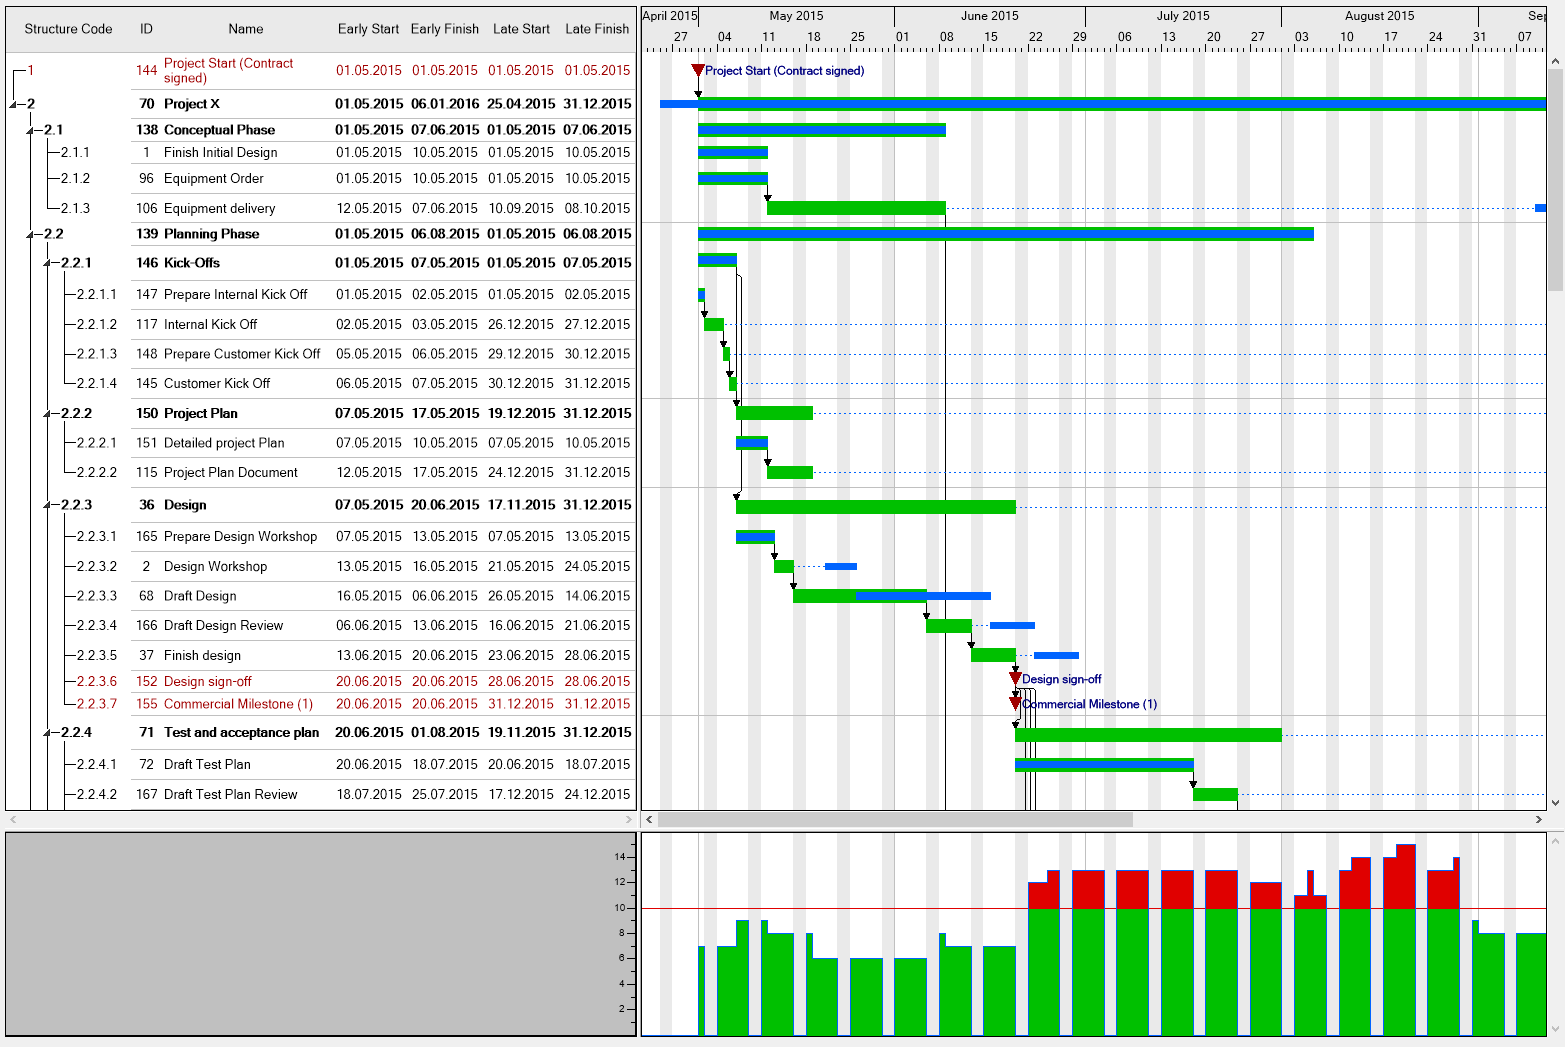
Create clear-cut and unambigous links between acitivities with predecessor and successor dependencies. Use different link types between the layers/bars and thus highlight them. Create, modify or delete links interactively in the Gantt chart. Use our Time Scheduler that plans activities automatically by forward and backward calculation from earliest start and latest end date and calculates the critical path on the basis of this data and the float times.
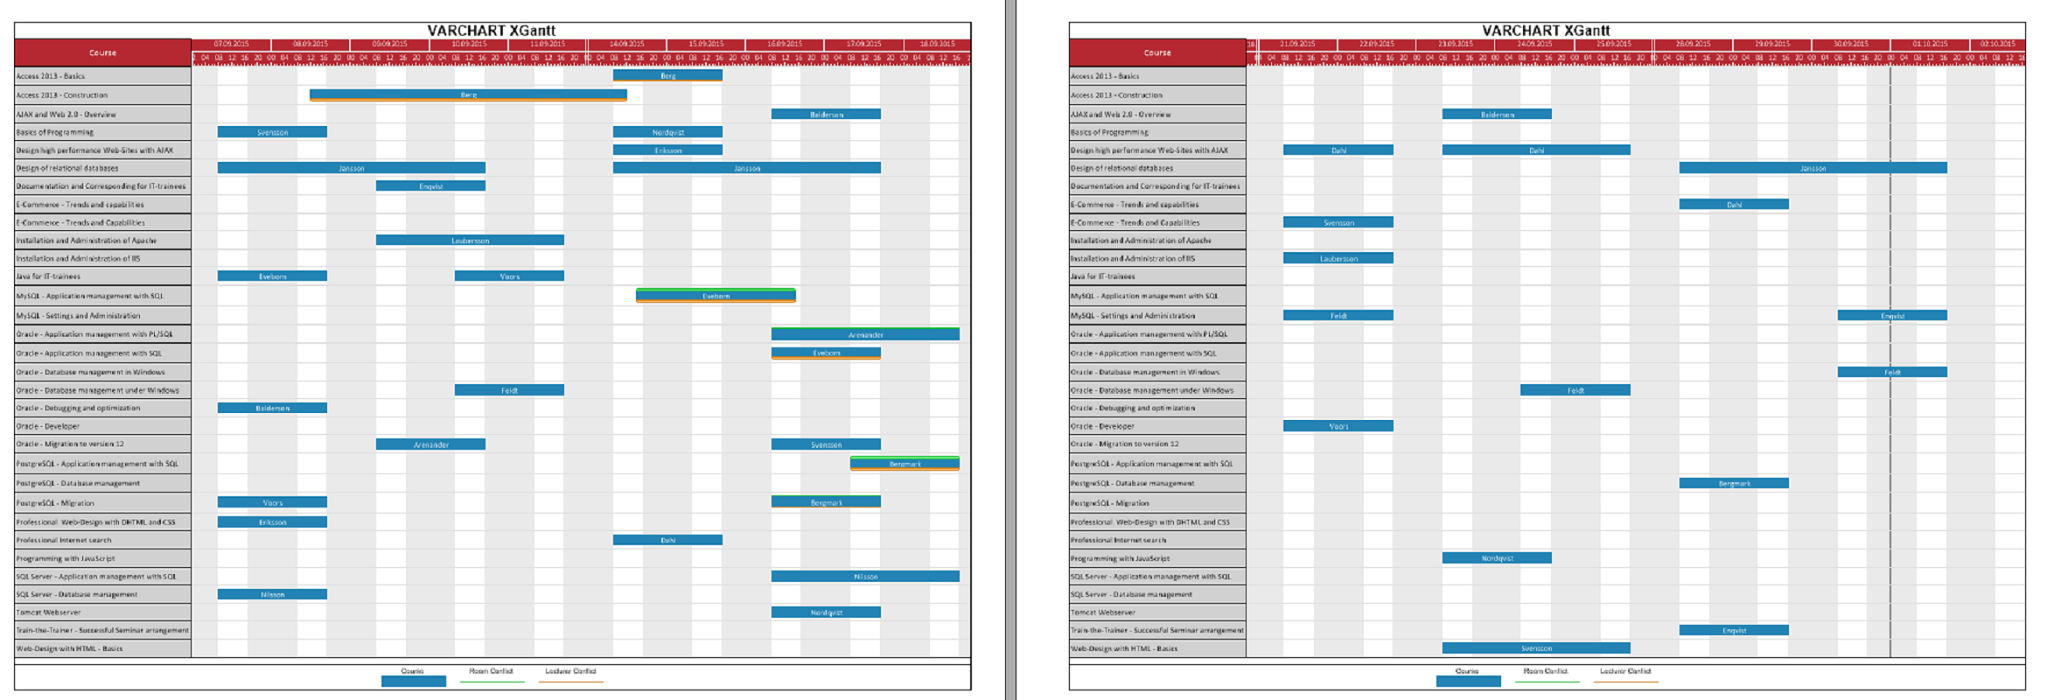
Our ActiveX and .NET Gantt chart control comes with powerful print capabilities. Define the page layout and view the result in the integrated page preview. Specify which diagram parts are to be repeated on each side and how title and legend are to be displayed. Have the time scale use the whole page width. Create pdf files to communicate your Gantt views in standardized electronical form.
Here are just a few examples what customers say about working with the .NET Gantt chart control VARCHART XGantt.
“By using NETRONIC’s XGantt easy-to-use and powerful control for visualizing order data in the Manufacturing Scheduler of our SAP® Business One Solution “Apparel and Footwear” our planning application has become still more visual and flexible."
Lucas Ritondale
Product Manager
Argentis Consulting

"As provider of standard solutions we absolutely need to use high quality components featuring an appropriate range of functionality and flexibility. Our satisfaction is shown by the fact that we have been using NETRONIC in different versions for 12 years now."
Hans-Christian Herter
Product Manager
MPDV Mikrolab GmbH

Customize the Production Order View and the Resource View in the Production Module in the NAV Classic Client by using a development license of VARCHART XGantt.
With a development license of VARCHART XGantt you can customize the Gantt charts in five modules of Dynamics AX.
Our controls VARCHART XNet and XTree are available as ActiveX and .NET Editions.
And see why hundreds of scheduling applications use VARCHART XGantt.